
Features
Network monitoring features that turn traffic into answers
Collect NetFlow, sFlow and IPFIX, record packets at up to 100 Gbit, recognise 450+ applications and ask an on-prem AI analyst what happened. Every feature runs on your own infrastructure.
Core features
Everything you need to see, record and understand traffic
NetFlow, sFlow and IPFIX collection
Collect flows from routers, switches and firewalls, or generate them from a mirror port or TAP.
Traffic recording
Record every packet to disk with n2disk, index it on the fly and pull the exact packets when an incident happens.
Application visibility (DPI)
See Teams, Netflix and TLS-encrypted apps, not just port 443, with 450+ protocols detected by nDPI.
AI network analysis
Ask questions in plain language and get charts, root causes and an evidence log, without sending data to the cloud.
High-speed packet capture
PF_RING and Cento keep up with 10 to 100 Gbit links on commodity hardware.
Alerts and threat detection
Behavioral checks flag scans, suspicious hosts and risky flows, with drill-down from alert to flow to packets.
Use cases that pay for themselves
Prove what caused the slowdown
Flows show who and when, recorded packets show exactly what. End the blame game between network and application teams.
See who uses your bandwidth
Top talkers, applications and countries in real time, so you stop guessing and start deciding.
Detect threats you cannot see in logs
Scans, beaconing and suspicious TLS fingerprints show up in traffic even when endpoints stay silent.
Keep sensitive data in-house
Self-hosted and open source. No cloud account and no traffic sent to a third party, including the AI assistant.
Monitor ISP and carrier networks
Collect flows from many routers, track ASNs and exporters, and defend against DDoS.
Plan capacity with real data
Historical flows and timeseries show growth by link, application and site before users complain.
Architecture
How the pieces fit together
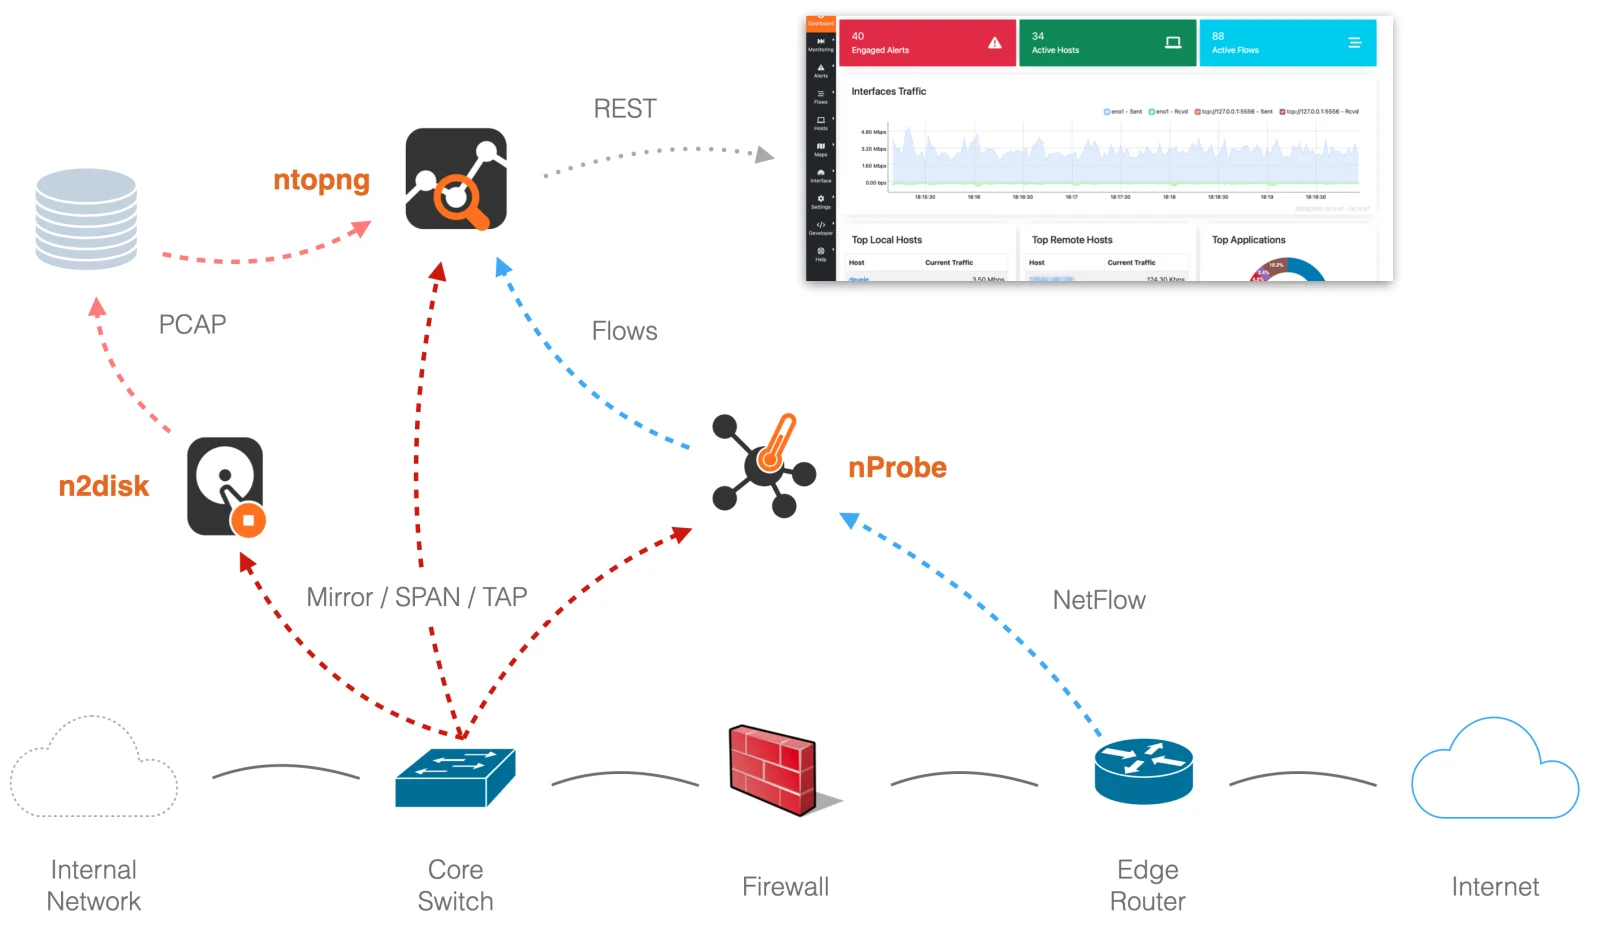
1. Capture
Packets from a mirror port or TAP, or flows from your routers. PF_RING and Cento handle the high speeds.
2. Analyze
nProbe turns packets into flows, nDPI labels every application, and ntopng shows hosts, flows and alerts.
3. Record and ask
n2disk keeps the packets as proof, and nAnalyst answers questions about everything it sees.
FAQ
Frequently asked questions
What features does ntopng include for free?
The Community edition includes real-time visibility and top talkers, Layer-7 application detection with nDPI, alerts, timeseries and network discovery. It is open source under GPLv3.
Do I need all the ntop products?
No. Start with ntopng alone. Add nProbe when your routers export NetFlow, n2disk when you need recorded packets, and nAnalyst when you want AI-assisted investigation.
Does my traffic leave my network?
No. ntop software is self-hosted and the nAnalyst AI assistant is designed to run on-premises.
Can it handle high-speed networks?
Yes. With PF_RING and nProbe Cento, ntopng analyzes traffic on 10 to 100 Gbit links, and n2disk can record up to 100 Gbit.
Get started
Try it on your own network
Download the free Community edition of ntopng, or talk to the ntop team about your requirements.