9. Syslog Log Ingestion
ntopng can collect logs from external sources including IDS systems, Firewalls or hosts running a standard syslog server.
Log collection from IDS systems like Suricata can be used to enrich ntopng with additional security-oriented information including flow metadata (extracted files is an example) and alerts detected by means of signature-based threat-detection algorithms. For further information about this use case please read the Suricata Integration section.
Firewall logs instead can be ingested by ntopng to provide visibility over firewall activities. An example is the Identity Management, in fact it is possible to track all connection/disconnection events logged by a VPN server, in order to associate traffic to users. ntopng Enterprise L includes plugin for collecting VPN logs and correlate network traffic to VPN users supporting multiple devices from the vendors below:
For further information about all the VPN plugins please also visit Syslog Behavioural Checks.
9.1. ntopng Configuration
In order to enable log ingestion from syslog in ntopng, a new syslog interface
should be added to the configuration file, with the syntax syslog://<ip>:<port>
Note that * is also supported to listen on any IP.
Example:
-i=syslog://*:5140
-i=eth1
By default, ntopng listens both on UDP and TCP, in order to listen on UDP only or TCP
only, the @udp or @tcp suffix should be appended to the interface name
(example syslog://*:5140@udp).
Note:
Multiple syslog clients can connect simultaneously to the same ntopng instance.
Remember to restart the ntopng service to apply the change.
Please make sure the firewall (including iptables on the same box) is not blocking connections to the configured port.
Please note that log demultiplexing should be configured in order to parse and display logs as described in the next section.
9.2. Logs Demultiplexing
ntopng does its best to automatically detect the producer of each log message, and
base on that parse the content and ingest all the contained information. However,
in some cases, this is not explicitly specified in the message and an hint is required
in order to figure out who is the producer of the log message and parse it correctly,
especially when the same syslog stream contains log messages from multiple producers.
This is usually not required with logs produced by IDS systems like Suricata for instance,
however it is mandatory with some Firewalls supporting Identity Management like
Fortinet and SonicWALL. For this reason, a Syslog Log Producers tab is available in the
syslog interface in the web GUI, where it is possible to configure all syslog sources by
providing the source IP address or the device name (as they appear in the log) and the
source type (e.g. Fortinet, or SonicWALL). Please note that some firewalls do not add
the IP address and device name to the log, in that case it is possible to use *
as IP address, it will be used as default in case no configured IP is matching.
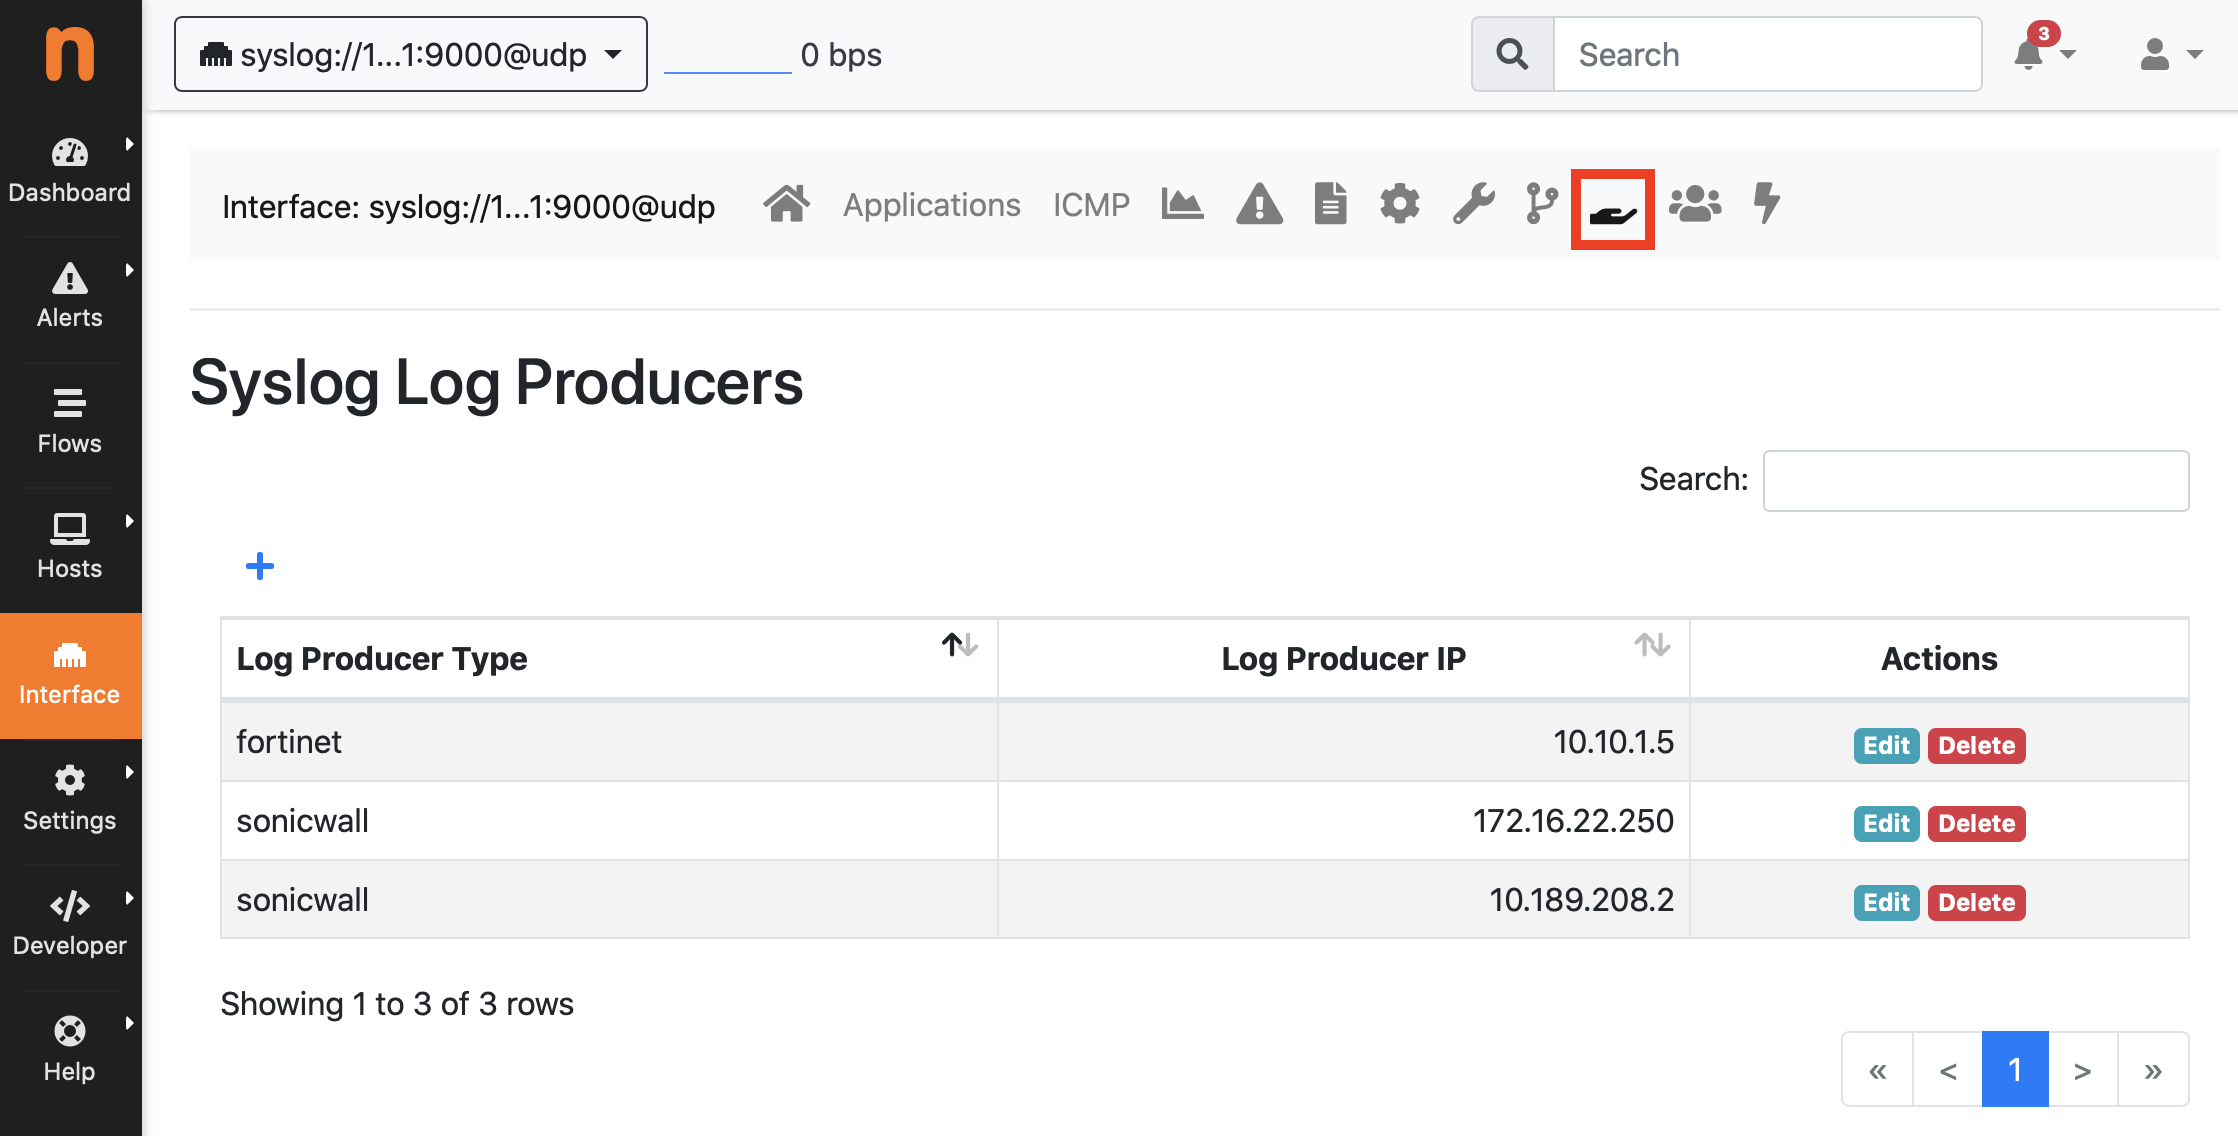
Syslog Log Producers Configuration
Note:
adding or removing sources does not require an application restart
if the Syslog Log Producers tab does not happear, the Identity Management plugins are probably not installed or available
9.3. Syslog Relay Configuration (Optional)
ntopng already includes a daemon able to listen for syslog logs on TCP or UDP at one (or more) configured endpoint. The log producer should be configured to send logs to that endpoint.
In some cases (e.g. an IDS running on the same host) a syslog client (the same applies
to relay configurations) like rsyslog should be installed and configured to export logs
to ntopng. This is possible by creating a new configuration file under /etc/rsyslog.d
specifying the IP, the port and the protocol where ntopng will listen for connections.
cat /etc/rsyslog.d/99-remote.conf
*.*  action(type="omfwd" target="127.0.0.1" port="5140" protocol="tcp" action.resumeRetryCount="100" queue.type="linkedList" queue.size="10000")
Please remember to restart the rsyslog service in order to apply the configuration.
Note: if log messages from the IDS are printed to the console by journalctl
as broadcast messages, you probably want to suppress them by setting
ForwardToWall=no in /etc/systemd/journald.conf.
Please remember to restart the systemd-journald service to apply the change.
It may be also required to edit /etc/rsyslog.d/50-default.conf commenting out
lines containing :omusrmsg:*.
9.4. Hosts Log Ingestion
The syslog integration in ntopng can also be used to collect logs from hosts in the network, and trigger alerts when some log exceeding the configured severity level is exceeded. This can be accomplished by creating the same configuration described in the previous section for setting up a Syslog Relay using rsyslog on each host. Example:
cat /etc/rsyslog.d/99-remote.conf
*.*  action(type="omfwd" target="10.0.0.1" port="5140" protocol="tcp" action.resumeRetryCount="100" queue.type="linkedList" queue.size="10000")
Please remember to restart the rsyslog service in order to apply the configuration.
At this point the host should start sending syslog logs to ntopng. In order to instruct ntopng to treat those logs as coming from hosts in the monitored network, it is requested to specify the producer IP and producer type (in this case Host Log) under Interface -> Syslog Log Producers as explained in the Logs Demultiplexing section.
Please note that it is also possible to change the severity level for controlling which log event should actually trigger an alert in ntopng under Settings -> Syslog -> Edit -> Host Log -> Edit.
It’s a common practice to setup syslog ingestion for (important) hosts in the monitored network. In this case it is convenient to have alerts generated in the same interface (the syslog interface should be used otherwise) where network traffic for the corresponding host is analysed. This is possible by configuring the syslog interface as companion interface under Interface -> Settings -> Companion Interface.
9.5. Network Syslog Ingestion
ntopng can ingest syslog messages from network devices and hosts, including routers, switches, firewalls, servers, and other syslog capable applications. The collector receives messages, evaluates configured ingestion rules, and stores accepted events in ClickHouse (thus an enterprise M or greater license, and clickhouse are needed. Start ntopng with -F clickhouse). By navigating to the menu entry Network and clicking on**Syslog** page lets operators configure those rules and inspect the ingested events. ntopng Enterprise XL and clickhouse are required.
9.5.1. Architecture and setup
The syslog collector listens on the configured syslog interface. For example,
the interface shown in the UI is syslog://*:5140. Configure the collector
to use the intended address and port for the deployment, then configure
routers, switches, hosts, and other syslog senders to forward their messages
to that ntopng endpoint.
The collector evaluates ingestion rules before writing accepted messages to ClickHouse. Rules are reloaded every 10 seconds, so rule changes are picked up without requiring a collector restart.
9.5.2. Ingestion rules
Rules are configured in the Syslog → Ingestion Rules tab. Use Add Syslog Rule to create a rule. The editor exposes these fields:
Enabled — enables or disables the rule.
Discard — when enabled, a matching message is dropped instead of being stored. Discard rules are evaluated before the other rules.
Severity — the least severe level matched by the rule. A message matches when its numeric severity is less than or equal to this value. For example, selecting Warning matches Emergency, Alert, Critical, Error, and Warning. Selecting Debug (7) matches every severity.
Source — optional sender IP address or CIDR network, such as
10.0.0.1or10.0.0.0/24. Leave empty to match any sender.Pattern — optional RE2 regular expression that must match the message. Leave empty to match any message.
Comment — a free text description to help operators identify the rule’s purpose.
A rule matches only when all of its configured conditions match: severity, source (if specified), and pattern (if specified).
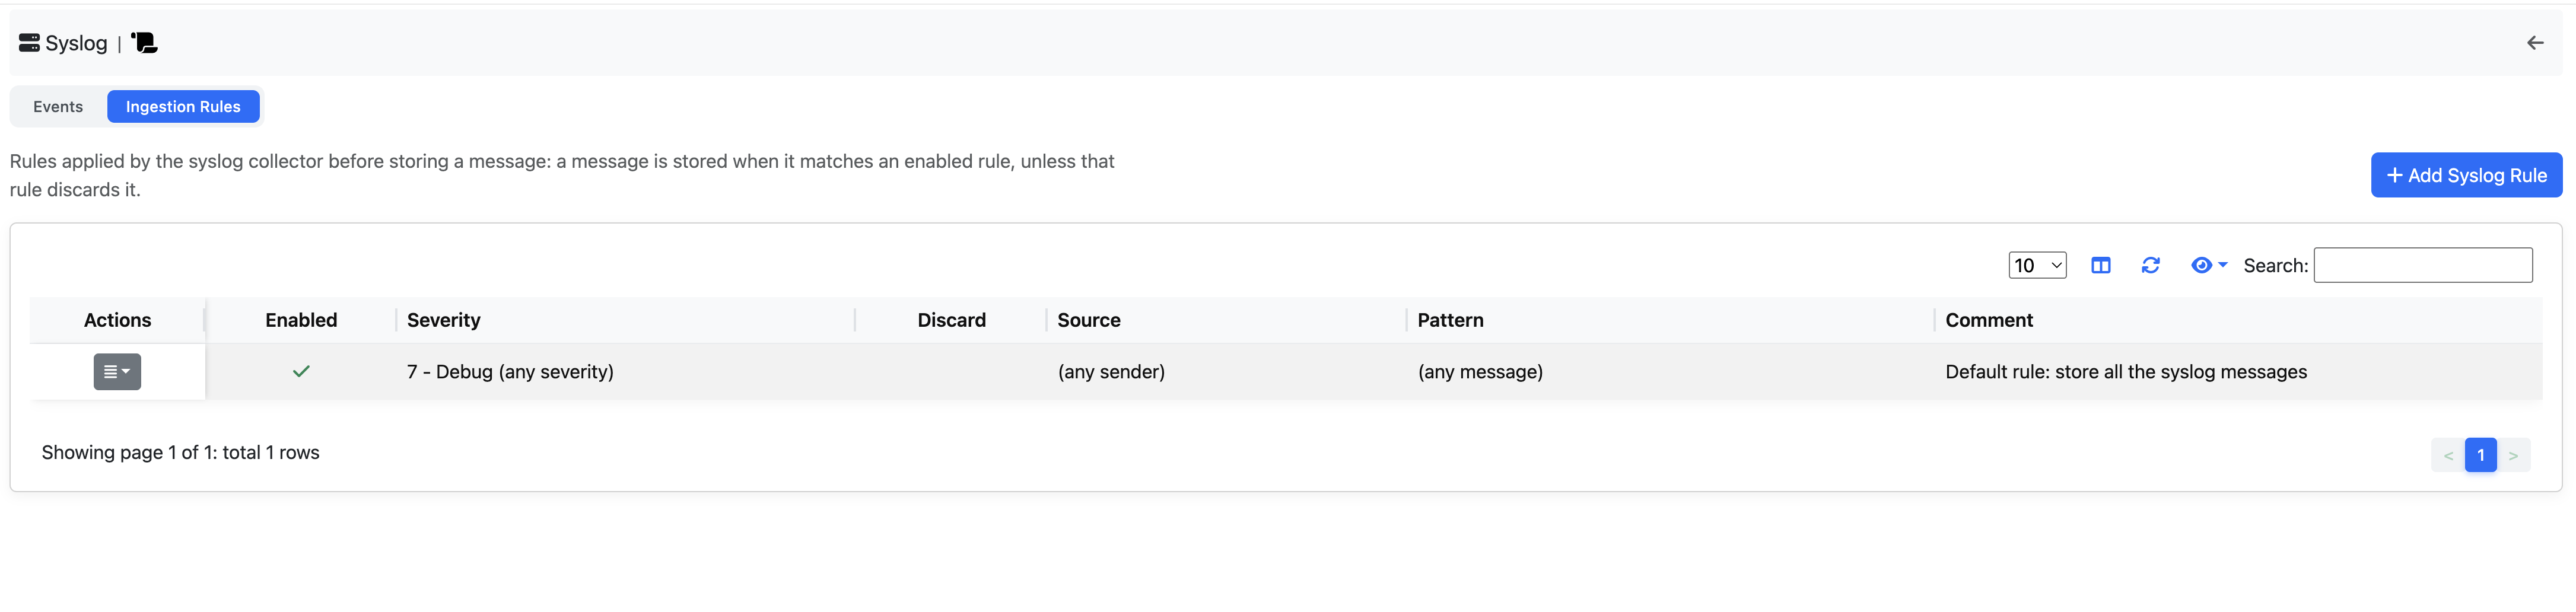
Visualize all syslog ingestion rules configured, and add new ones
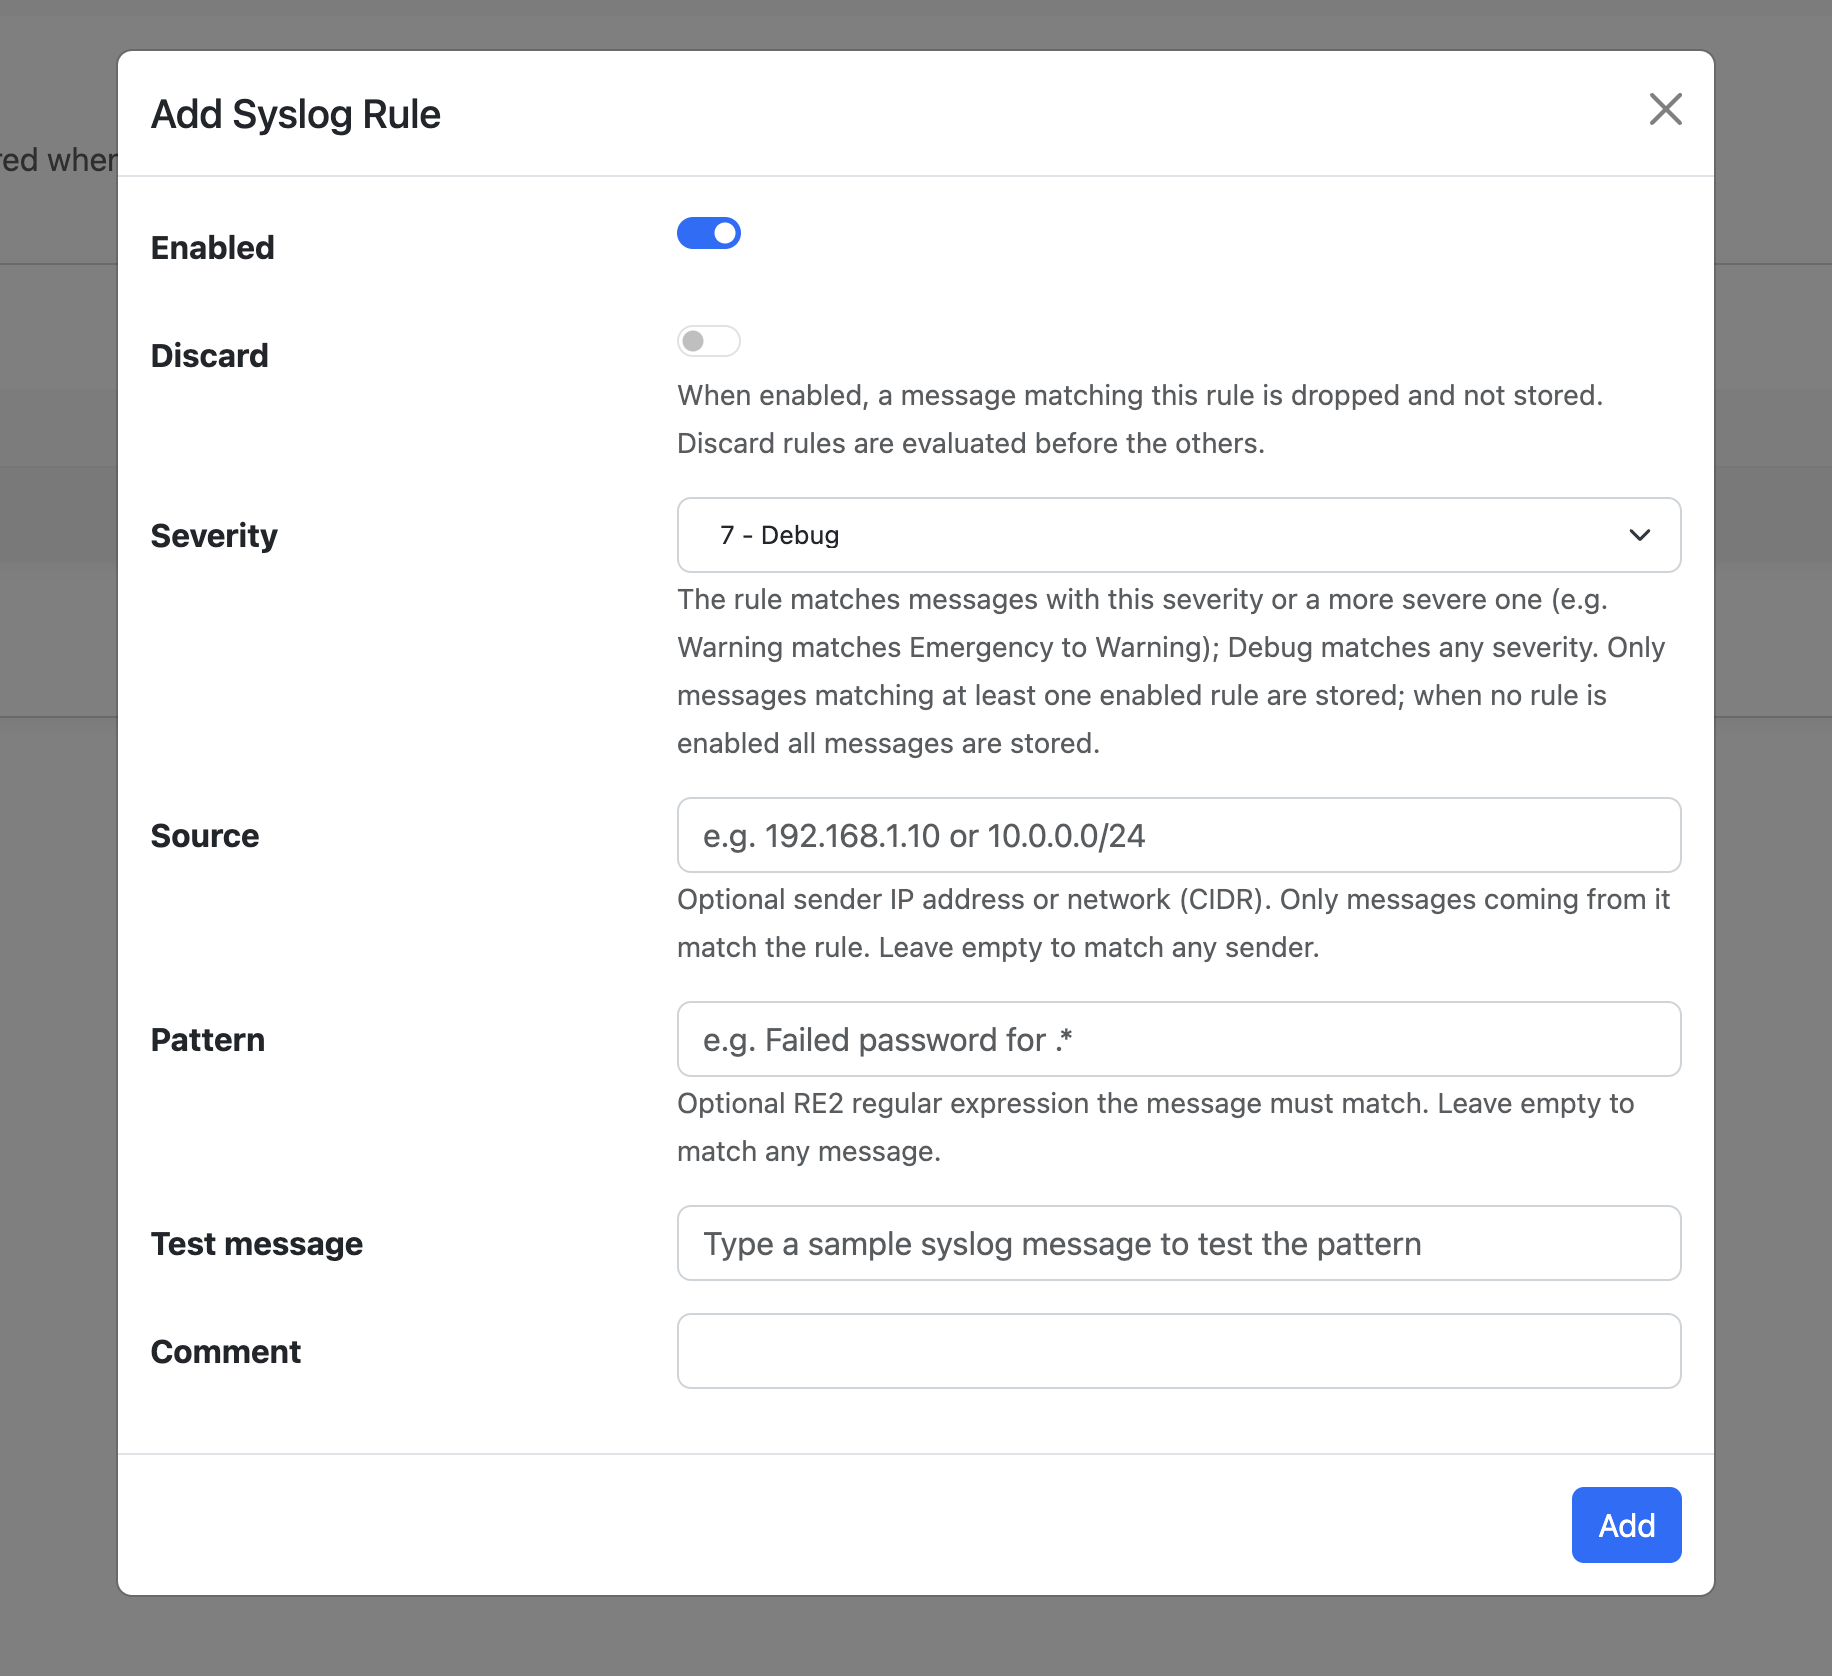
Add a rule for syslog ingestion
9.6. Rule evaluation
Enabled rules act as an allowlist: when at least one enabled rule exists, a message is stored only if it matches an enabled non discard rule and is not dropped by a matching discard rule. Discard rules are evaluated first. If no rules are enabled, all messages are stored.
The collector reloads the rules every 10 seconds. Allow for this interval when verifying a change.
9.6.1. Events view
The Syslog → Events tab displays messages received by the collector and stored in ClickHouse. Select a group in the filter panel to narrow the event table. Available groups include:
Severity
Source IP
Hostname
Application
Facility
The counts shown beside each group value indicate the number of matching events in the current result set. Selecting a value filters the table to that group.
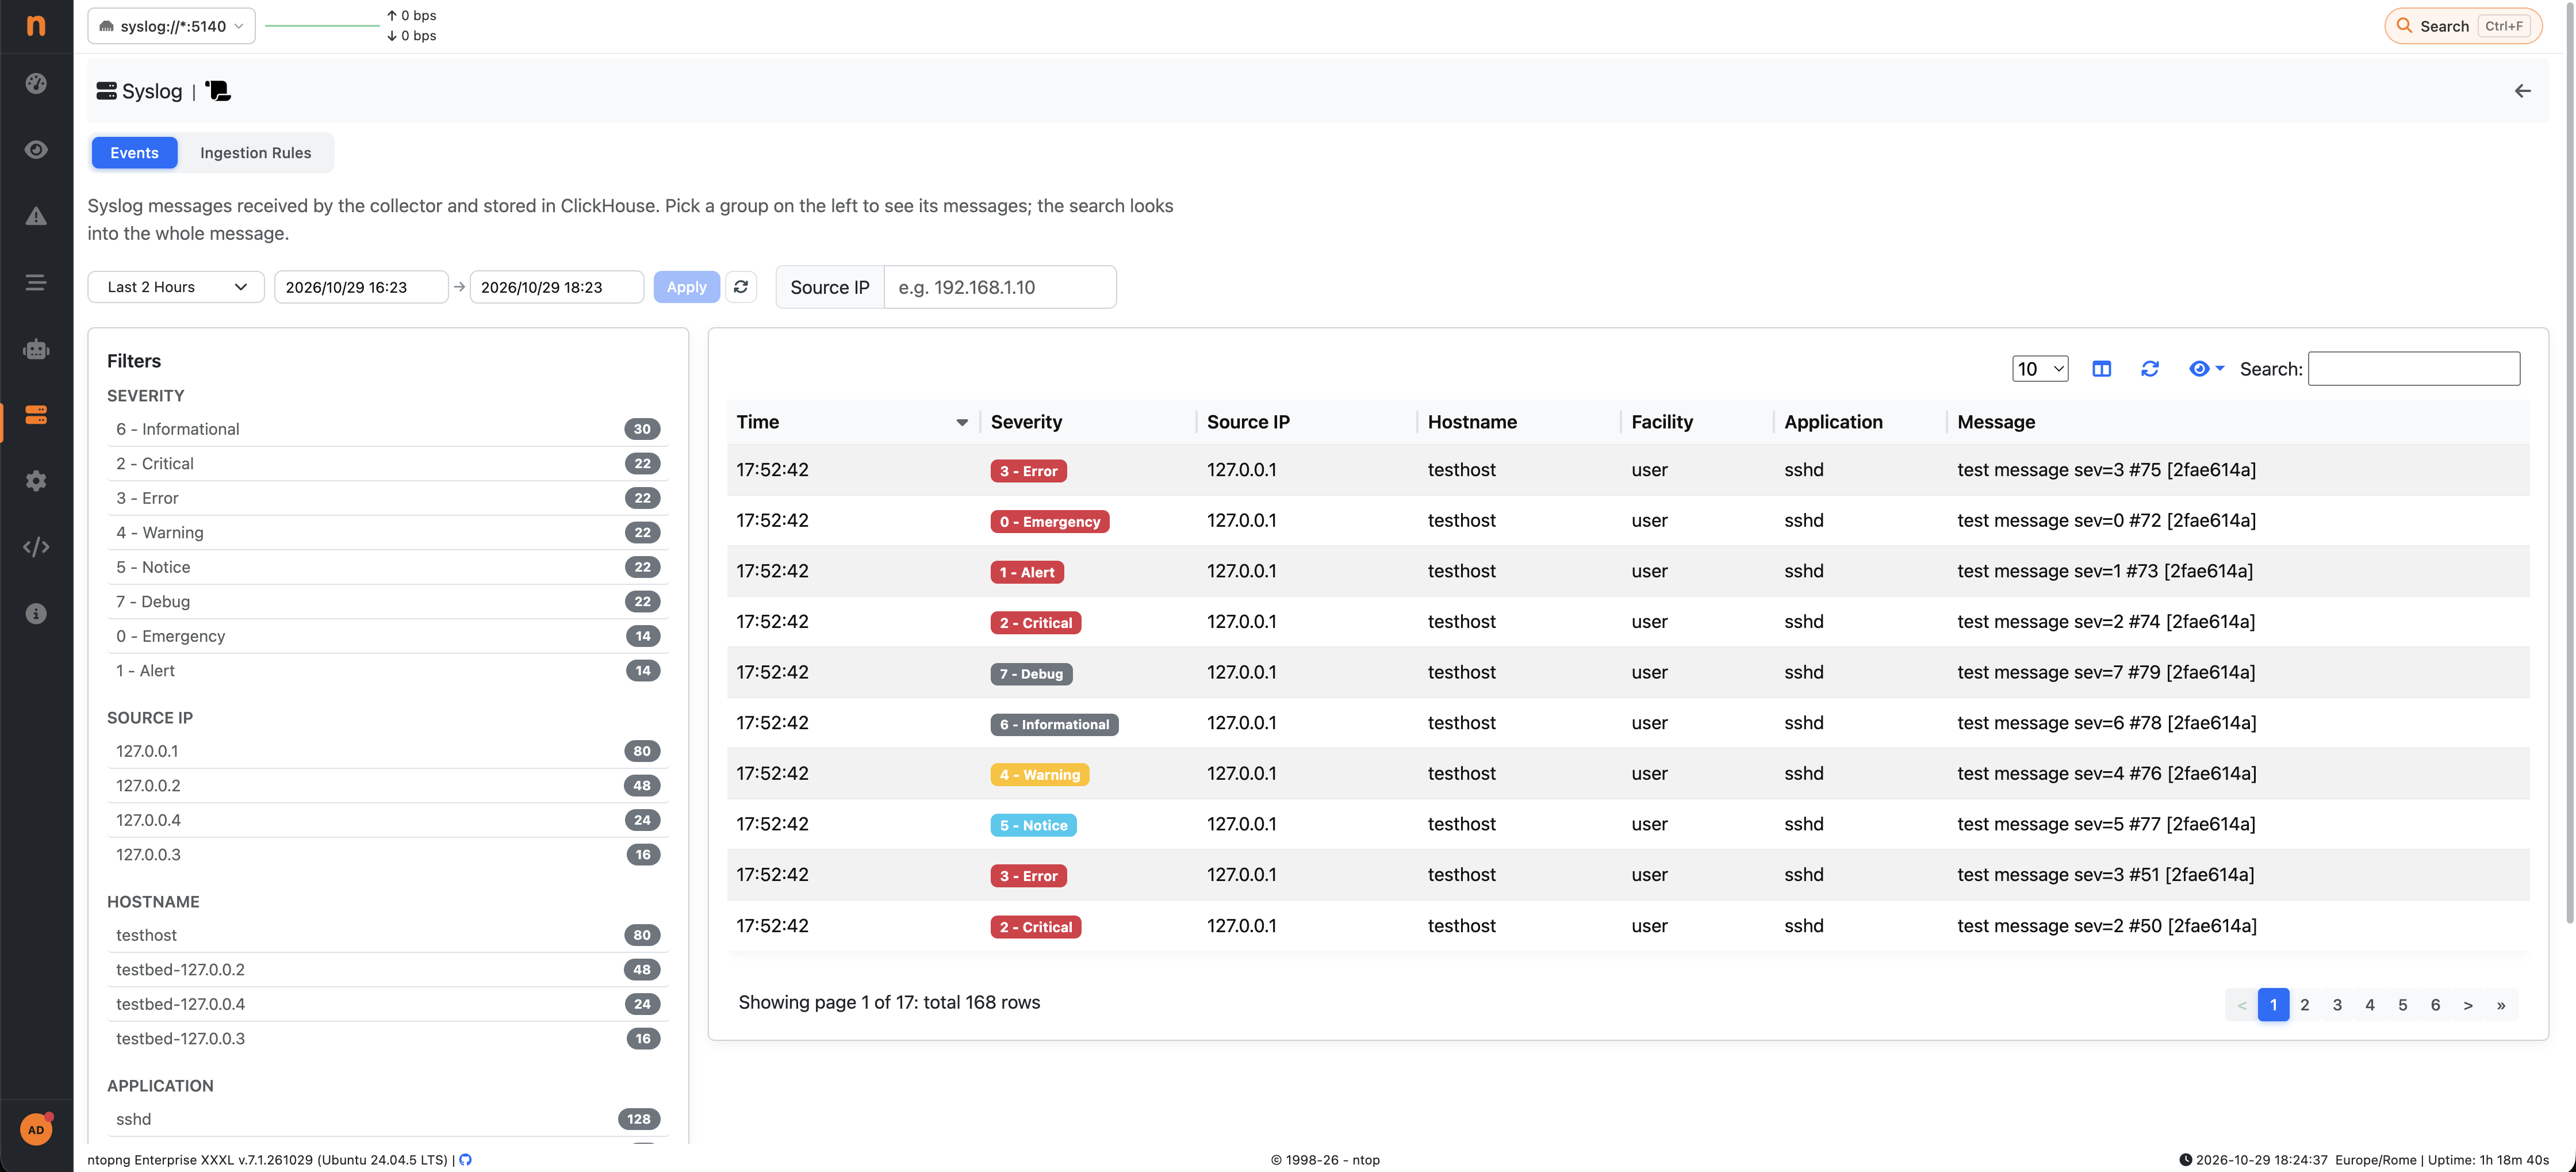
Visualize all collected syslog events in a table with filters
The page provides the following controls:
Time range — select a preset range or specify start and end times, then select Apply to refresh the results.
Source IP — filter by a sender IP address.
Search — search within the full message text.
Table controls — adjust the number of rows displayed per page, refresh the results, and navigate between pages.
The event table includes:
Time — time associated with the displayed event.
Severity — numeric severity and its label.
Source IP — sender address.
Hostname — hostname reported in the syslog header.
Facility — syslog facility, such as
auth,kern,daemon, oruser.Application — application name reported in the message, such as
sshd,nginx, orcron.Message — the syslog message text.
Use the time range and group filters to isolate events from a device or application, then use message search to find a particular error, identifier, or text fragment.
9.6.2. Alert correlation
Syslog ingestion establishes the event data needed for future alert correlation. A planned follow up is to correlate stored syslog events with ntopng alerts, allowing operators to investigate network activity alongside device and application logs. Until that correlation is implemented, the Events page should be treated as a searchable view of ingested syslog messages, rather than as proof that a syslog event has triggered or been linked to an ntopng alert.
9.7. nBox Log Ingestion
nBox appliances based on the nBox UI are able to export events to syslog. This includes the activity of users starting and stopping applications and services, and software failures. Syslog logs generated by nBox UI can be ingested by ntopng and used to generate alerts. This requires the syslog format to be configured to JSON in the nBox UI Notifications preferences. The ntopng address (including the port used for listening for syslog logs) should be also configured.
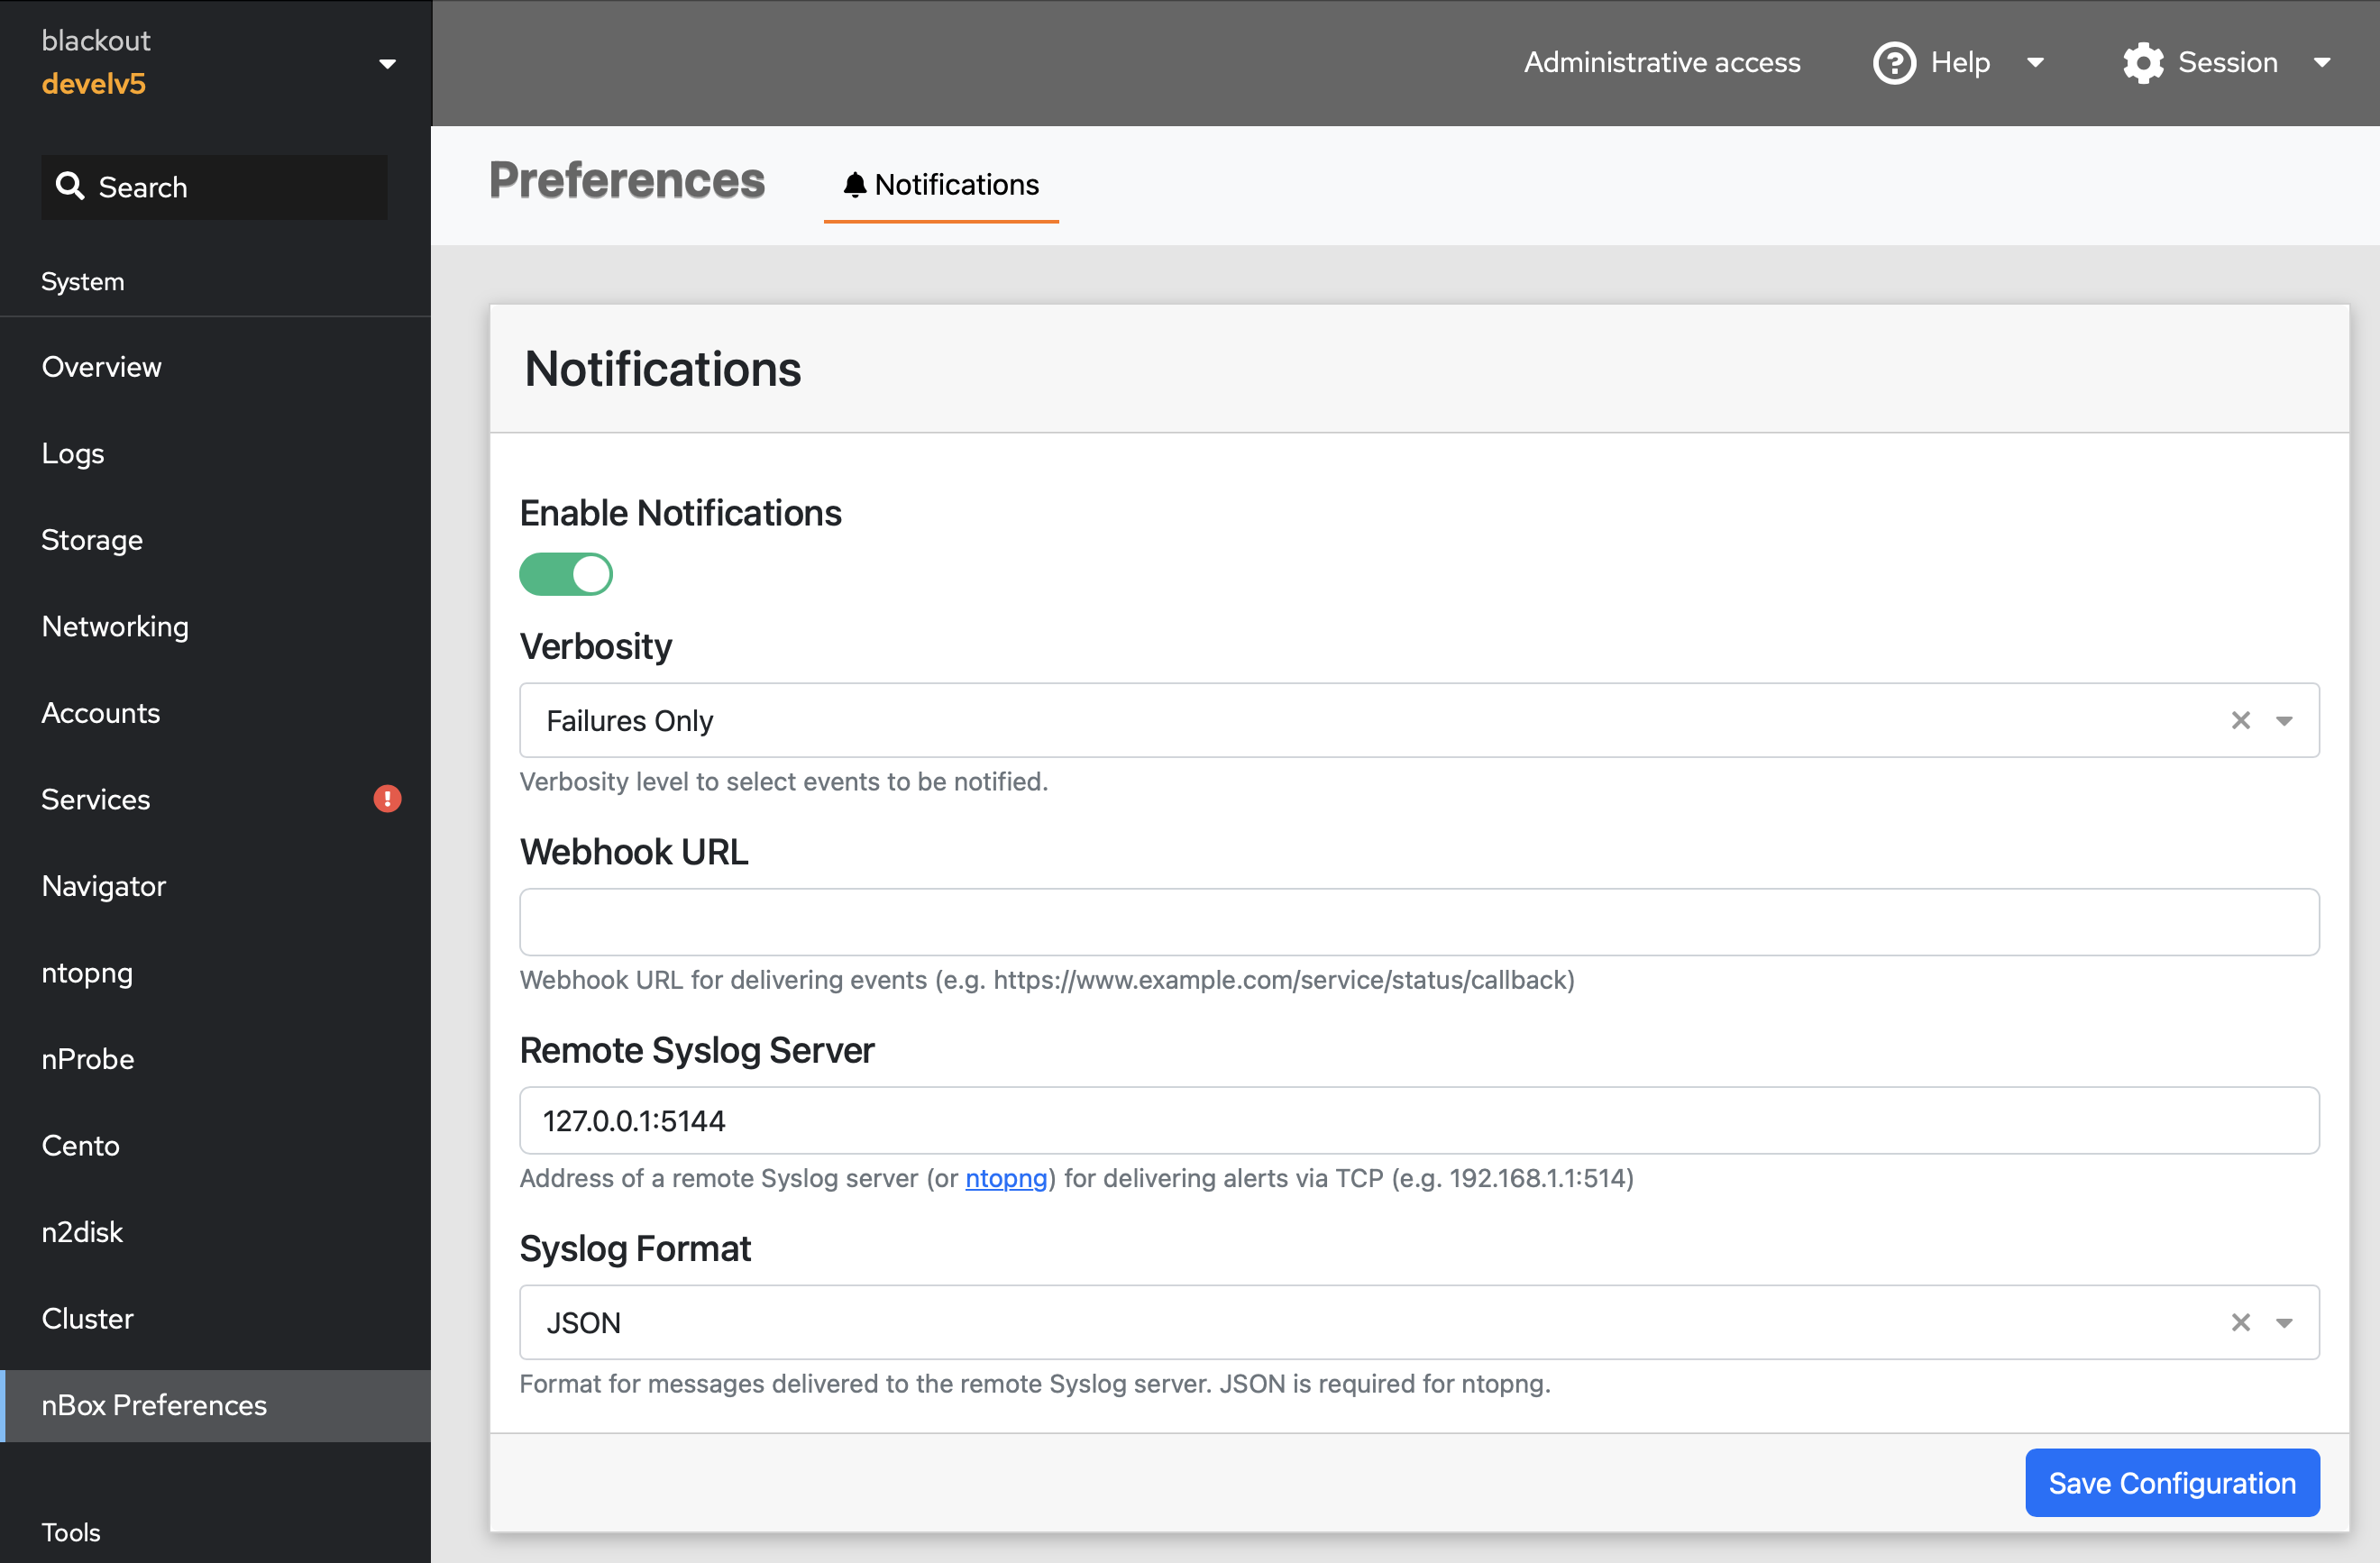
nBox UI Notifications Settings
The Syslog Log Producers configuration for the syslog interface in ntopng should be configured to decode syslog logs as nBox UI logs by configuring nBox as log producer.
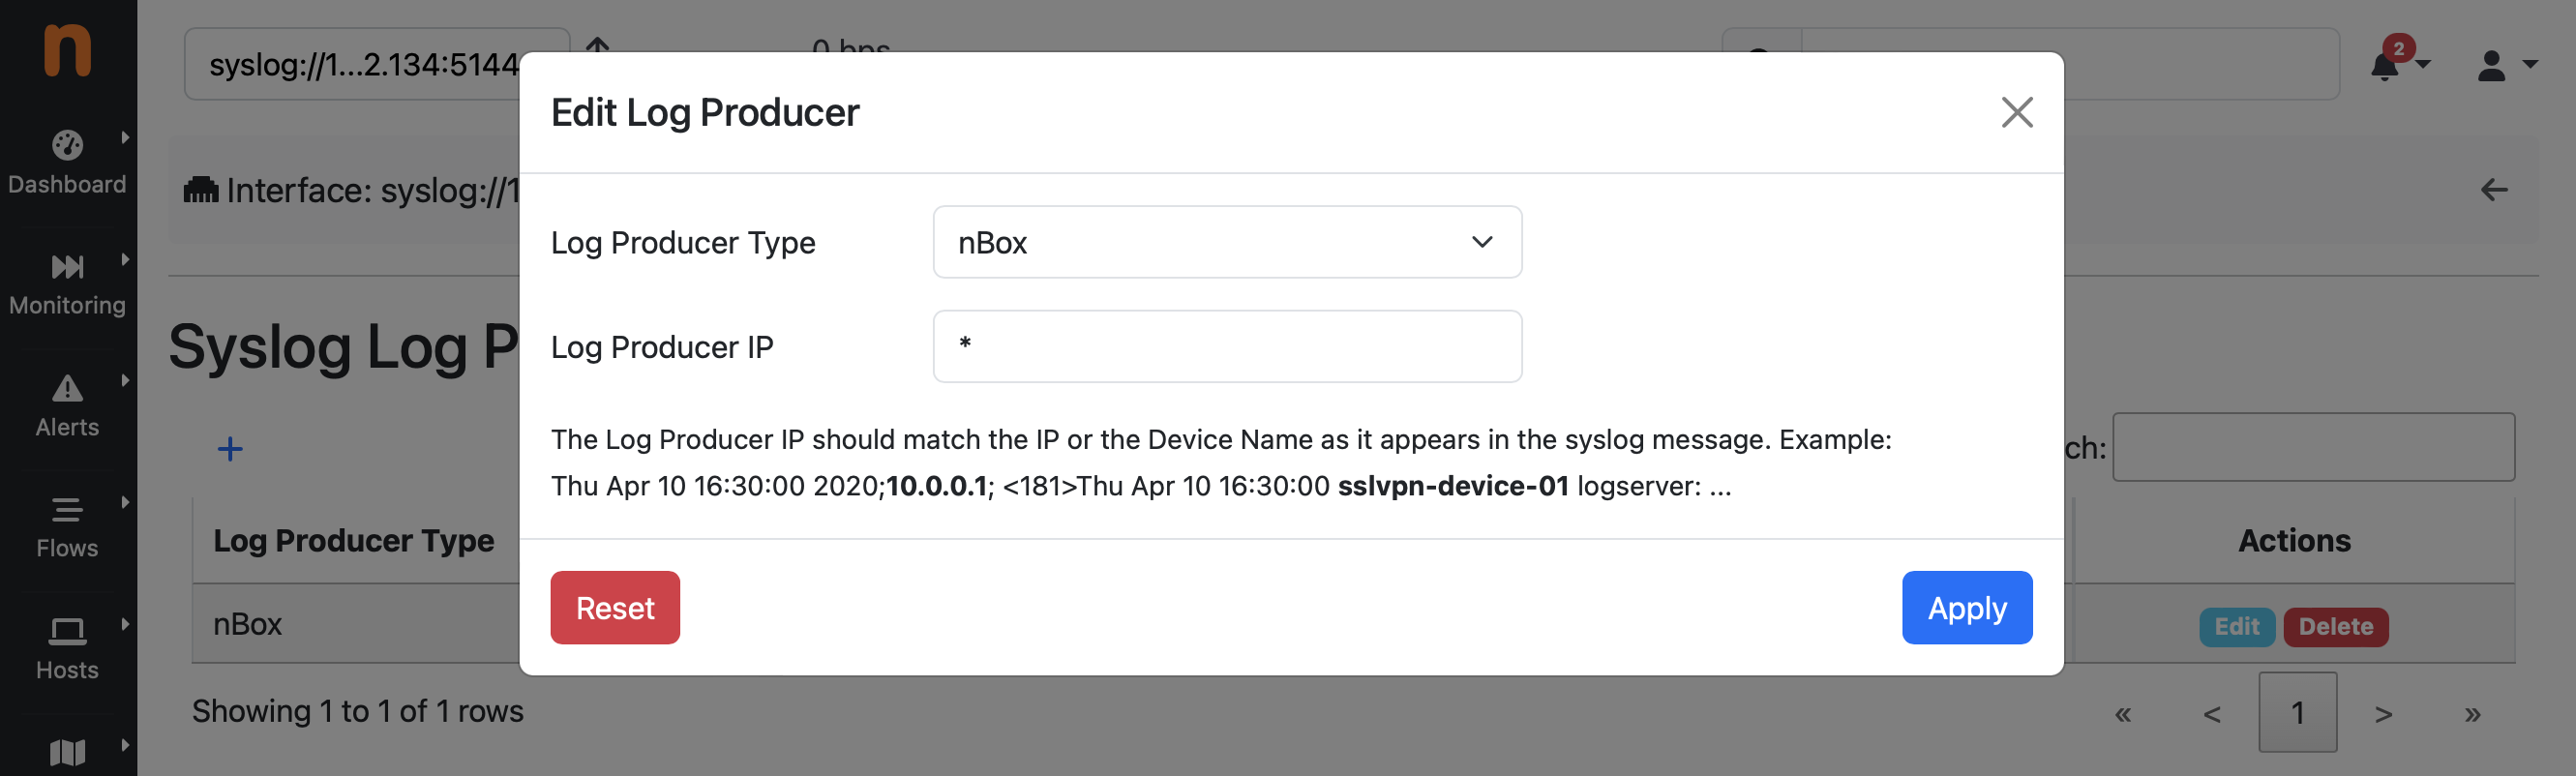
Syslog Log Producers Configuration
At this point, ntopng should be able to ingest and decode events from the nBox appliance and the Alerts Notifications can be configured to deliver those events to the administrator via any supported Notification Endpoint and Recipient.
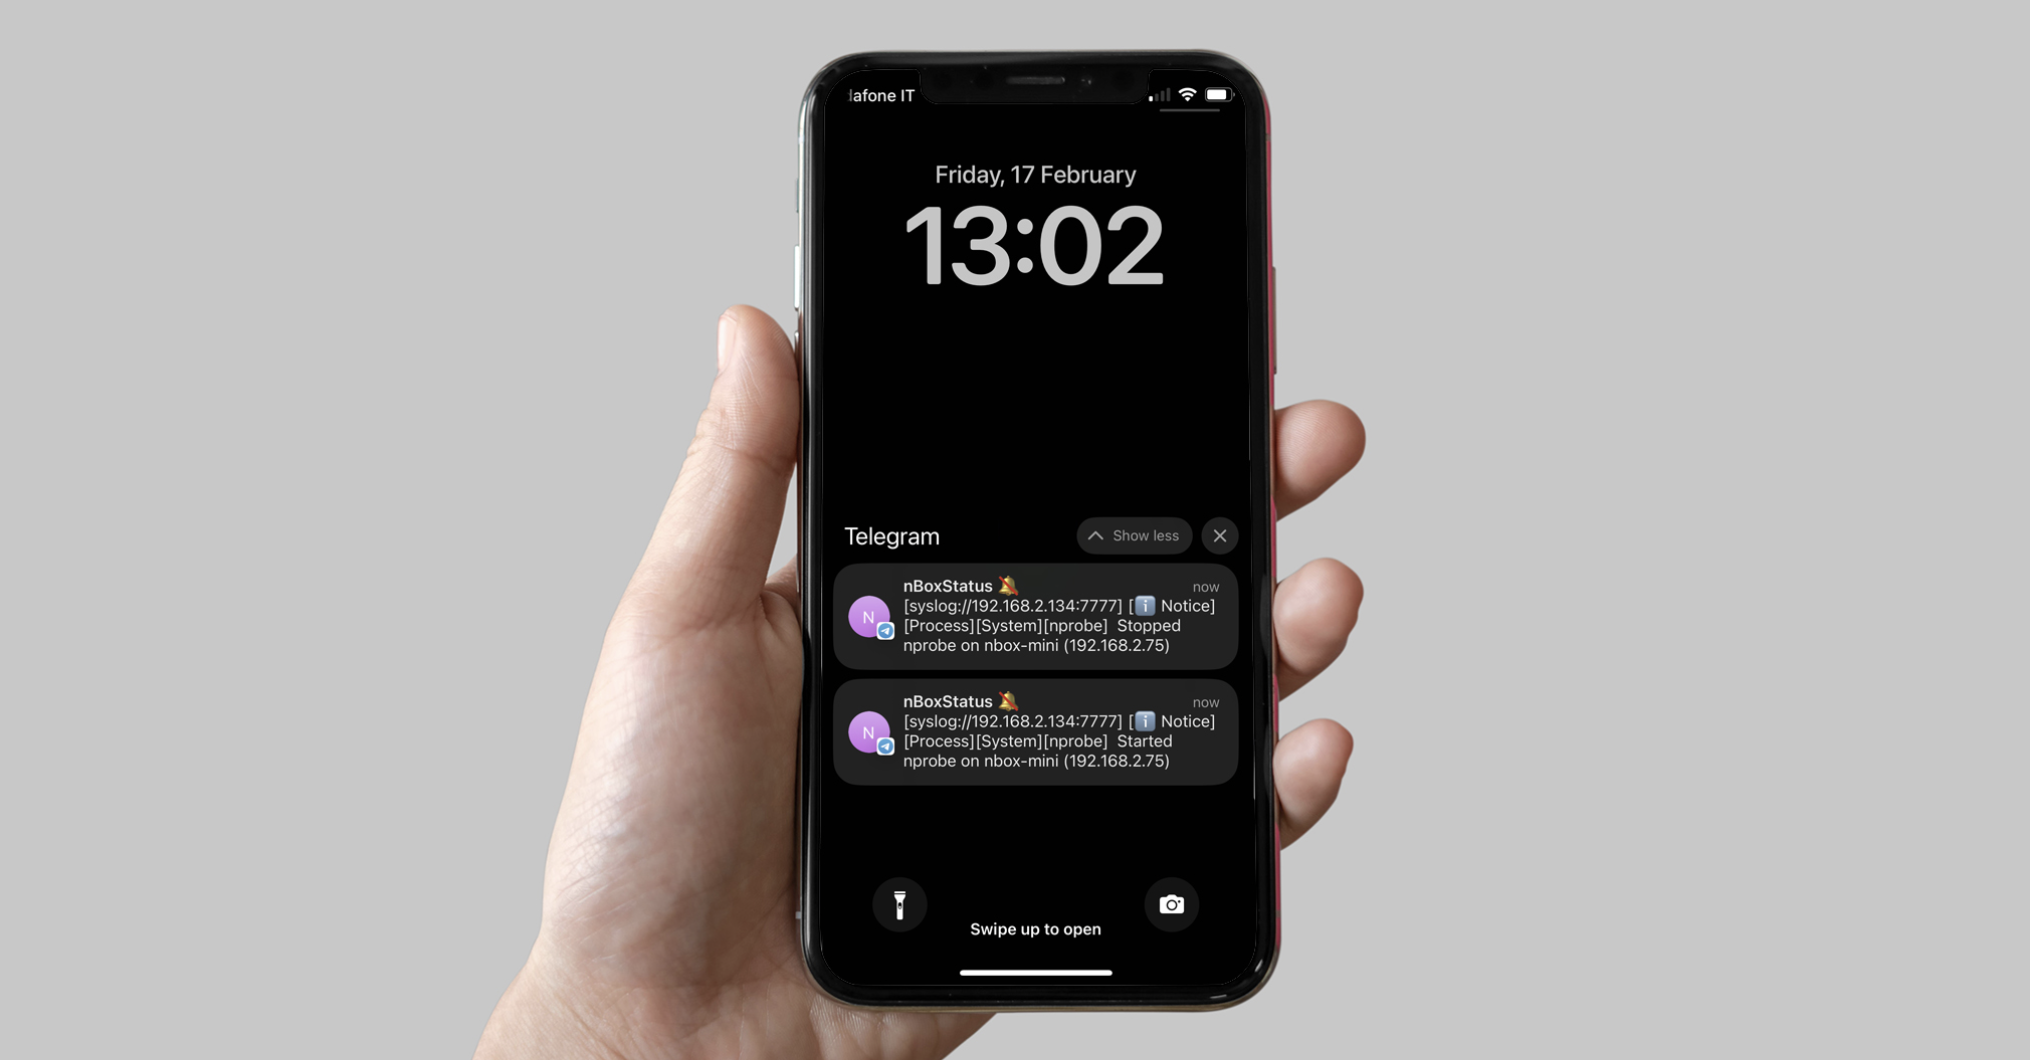
nBox UI Telegram Notification